Higher-level only
The progress of a chemical reaction can be presented graphically in terms of chemical potential energy.
Syllabus ref: R2.2.7Reactivity 2.2.7 - Energy profiles can be used to show the activation energy and transition state of the rate-determining step in a multistep reaction. (HL)
- Construct and interpret energy profiles from kinetic data.
Guidance
Tools and links
Rate = k[A]x[B]y
Chemical potential energy profiles
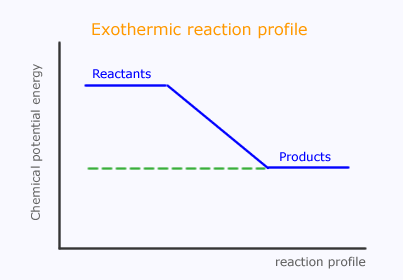
In an exothermic reaction the products have less chemical potential energy than the reactants. This is presented in a graphical manner as a reaction profile.

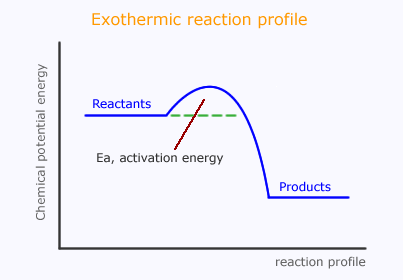
However, as we have discussed, the reacting particles need to have sufficient energy during the collisions to promote reaction. This is the activation energy, which can now be represented on the reaction profile.

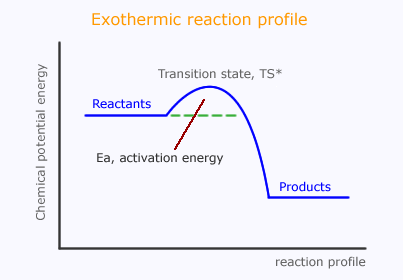
This suggests that the reactants pass through a temporary high energy state, probably the actual moment of collision. This is said to be a "high energy transition state" and is sometimes shown with an asterisk, *.

Multi-step reactions
In a multi-step reaction, each step can be represented by an individual profile diagram. These can all be put together to make an energy profile showing the progress of the chemical potential energy in the reaction.
When the reaction step is slow the activation energy is high and vice-versa.
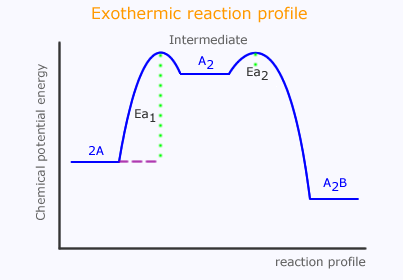
Consider a reaction that proceeds via two steps, the first rate determining step is slow and the second is fast.
Step 1 slow): 2A ⇋ A2
Step 2 (fast): A2 + B → A2B
The slow step has high activation energy and the fast step has low activation energy. The reaction proceeds via an intermediate species, A2.

It is important to appreciate the difference between a high-energy transition state, which is just a logical necessity when a collision occurs that breaks bonds, and an intermediate, which is a species with a definite identity.
In the diagram above, there are two high-energy transition states, but only one intermediate.
Energy profile from kinetic data
The rate equation tells us the dependency of the overall rate on the individual reactants. This, in turn, allows us to propose reaction mechanisms that fit the data.
For example, in the reaction used above:
2A + B → A2B
Solving the rate equation, we find that the order with respect to [A] = 2, and the order with respect to [B] = 0.
This leads us to suggest that there are two steps to the reaction, and that the rate determining step (the slow step) does not involve B.
The order of reaction with respect to [A] is 2, suggesting that there are two particles of A invoved in the rate determining (slow) step.
Step 1 slow): 2A ⇋ A2
Step 2 (fast): A2 + B → A2B
We can now start to construct the energy profile. A slow step must have a very high activation energy, Ea1, while the fast step has a low activation energy, Ea2.

Worked examples
Q631-01 The following initial rate data were collected for the reaction:aA(g) + bB(g) → cC(g) + dD(g)
|
|
[A]
|
[B]
|
[C]
|
[D]
|
initial rate/ mol dm-3 s-1
|
| Expt 1 |
0.422
|
1.52 x 10⁻²
|
0
|
0
|
2.72 x 10⁻⁵
|
| Expt 2 |
0.638
|
1.21 x 10⁻²
|
0
|
0
|
4.93 x 10⁻⁵
|
| Expt 3 |
0.921
|
1.52 x 10⁻²
|
0
|
0
|
1.29 x 10⁻⁴
|
Find the rate law that best fits this data.
|
In experiments 1 and 3 the concentration of B remains the same, so any effect on the rate is due to concentration of A. Between expts 1 and 3 the concentration of A changes by a factor of 0.921/0.422 = 2.18 At the same time the rate changes by a factor of 4.74 If we square the value 2.18 we get 4.75 therefore the reaction is second order with respect to [A] Considering expt 1 and 2 the concentration of A increases by a factor of 0.638/0.422 = 1.51 We would expect this to have a corresponding effect on the rate of a factor of 1.512 = 2.29 Inspection of the rate change between experiments 1 and 2 reveals an increase by a factor of 4.93/2.72 = 1.81 During this time the concentration of B decreases by a factor of 1.52/1.21
=1.26 The order is therefore first with respect to [B] Therefore the full rate expression is: Rate = k[A]2[B]1 |
Q631-02 For the reaction between hydrogen peroxide and iodide ions in acid solution, represented by the equation:
H2O2 + 3I- + 2H+ → I3- + 2H2O
these kinetic data were gathered:
|
|
[H2O2]
|
[I-]
|
[H+]
|
initial rate/ mol dm-3 s-1
|
| Expt 1 |
0.010
|
0.010
|
0.00050
|
1.15 x 10⁻⁶
|
| Expt 2 |
0.020
|
0.010
|
0.00050
|
2.30 x 10⁻⁶
|
| Expt 3 |
0.020
|
0.020
|
0.00050
|
4.60 x 10⁻⁶
|
| Expt 4 |
0.020
|
0.020
|
0.00100
|
4.60 x 10⁻⁶
|
What is the rate law for the reaction?
Answer|
By inspection of expts 1 & 2: ([I-] [H+]
are both constant, therefore any change in the rate is due to [H2O2]) By inspection of expts 2 & 3: ([H2O2] [H+]
= constant, therefore any change in the rate is due to [I-]) By inspection of expts 3 & 4: ([H2O2] [I-]
= constant, therefore any change in the rate is due to [H+]) The rate expression is therefore: Rate = k [H2O2]1[I-]1[H+]0 |
Q631-03 A certain zero-order reaction has a value for the rate constant, k = 0.025 mol dm-3 s-1 for the disappearance of A. What will be the concentration of A after 15 seconds, if the initial concentration is 0.50 mol dm-3?
Answer
|
For a zeroth order reaction, Rate = k[A]0 From this the concentration does not affect the rate. Therefore Rate = k = 0.025 mol dm-3 s-1. After 15 seconds the number of moles used up = 15 x 0.025 = 0.375 mol dm-3 If the initial concentration = 0.5 mol dm-3 Then the mol dm-3 remaining = 0.5 - 0.375 = 0.125 mol dm-3 |
Q631-04 The following initial rate data were collected for the reaction:
aA(g) + bB(g) → cC(g) + dD(g)
| [A] | [B] | initial rate/ mol dm-3 s-1 | |
| Expt 1 | 0.42 | 1.5 x 10⁻² | 2.7 x 10⁻⁵ |
| Expt 2 | 0.42 | 3.0 x 10⁻² | 5.4 x 10⁻⁵ |
| Expt 3 | 0.84 | 1.5 x 10⁻² | 1.1 x 10⁻⁴ |
Find the orders of reaction with respect to [A] and [B], and hence the rate expression.
Answer|
Firstly, remember that the stoichiometry of the equation has NO EFFECT on the rate equation. By inspection of experiments 1 and 2, you can see that the concentration of B doubles while [A] remains constant. Meanwhile, the initial rate doubles. Thus [B] is directly proportional to the initial rate, therefore the order with respect to [B] is one. By inspection of experiments 1 and 3, you can see that the concentration of A doubles while [B] remains constant. However, the initial rate increases by a factor of four. Thus [A] has a squared effect on the initial rate, therefore the order with respect to [A] is 1. The rate equation is therefore: Rate = k [A]2[B]1 |
Q631-05 The following initial rate data were collected for the reaction:
aA(g) + bB(g) → cC(g) + dD(g)
| [A] | [B] | initial rate/ mol dm-3 s-1 | |
| Expt 1 | 0.42 | 1.5 x 10⁻² | 2.7 x 10⁻⁵ |
| Expt 2 | 0.42 | 3.0 x 10⁻² | 5.4 x 10⁻⁵ |
| Expt 3 | 0.84 | 1.5 x 10⁻² | 2.7 x 10⁻⁵ |
Find the orders of reaction with respect to [A] and [B], and hence the rate expression.
Answer|
Firstly, remember that the stoichiometry of the equation has NO EFFECT on the rate equation. By inspection of experiments 1 and 2, you can see that the concentration of B doubles while [A] remains constant. The initial rate meanwhile doubles. Hence, [B] is proportional to the initial rate, therefore the order with respect to [B] is one. By inspection of experiments 1 and 3, you can see that the concentration of A doubles while [B] remains constant. However, the initial rate remains unchanged. Thus [A] has no effect on the initial rate, therefore the order with respect to [A] is 0. The rate equation is therefore: Rate = k [A]0[B]1 |
Q631-06 The following initial rate data were collected for the reaction:
2NO(g) + 2H2(g) → N2(g) + 2H2O(g)
| [NO] | [H2] | initial rate/ mol N2 dm-3 s-1 | |
| Expt 1 | 0.1 | 0.1 | 2.53 x 10⁻⁶ |
| Expt 2 | 0.1 | 0.2 | 5.05 x 10⁻⁶ |
| Expt 3 | 0.2 | 0.1 | 1.01 x 10⁻⁵ |
Find the orders of reaction with respect to [NO] and [H2], and hence the rate expression.
Answer|
Firstly, remember that the stoichiometry of the equation has NO EFFECT on the rate equation. By inspection of experiments 1 and 2, you can see that the [H2] doubles while [NO] remains constant. Meanwhile, the initial rate also doubles. Thus [H2] is directly proportional to the initial rate, therefore the order with respect to [H2] is one. By inspection of experiments 1 and 3, you can see that the concentration of [NO] doubles while [H2] remains constant. Meanwhile, the initial rate increases by a factor of four. Thus [NO] has a squared effect on the initial rate, therefore the order with respect to [NO] is 1. The rate equation is therefore: Rate = k [H2]1[NO]2 |
Q631-07 The following data were obtained for the reaction of nitrogen monoxide gas, NO(g) with oxygen gas to form nitrogen dioxide gas, NO2(g) at 25ºC.
| [NO] | [O2] | initial rate/ mol dm-3 s-1 | |
| Expt 1 | 0.50 | 0.2 | 2.7 x 10⁻⁵ |
| Expt 2 | 0.50 | 0.4 | 5.4 x 10⁻⁵ |
| Expt 3 | 1.00 | 0.2 | 5.4 x 10⁻⁵ |
Find the orders of reaction with respect to [NO] and [O2], and hence the rate expression.
Answer|
Firstly, remember that the stoichiometry of the equation has NO EFFECT on the rate equation. By inspection of experiments 1 and 2, you can see that the [O2] doubles while [NO] remains constant. Meanwhile, the initial rate doubles. Thus [O2] has a proportional effect on the initial rate, therefore the order with respect to [O2] is one. By inspection of experiments 1 and 3, you can see that [NO] doubles while [O2] remains constant. Meanwhile, the initial rate remains also doubles. Thus [NO] has a directly proportional effect on the initial rate, therefore the order with respect to [NO] is 1. The rate equation is therefore: Rate = k [NO]1[O2]1 |
Q631-08 The following data were obtained for the reaction of compounds A and B at constant temperature.
| initial [A]/mol dm-3 | initial [B]/mol dm-3 | initial rate/ mol dm-3 s-1 | |
| Expt 1 | 0.15 | 0.24 | 0.45 x 10⁻⁵ |
| Expt 2 | 0.30 | 0.24 | 0.90 x 10⁻⁵ |
| Expt 3 | 0.60 | 0.48 | 7.20 x 10⁻⁵ |
Find the orders of reaction with respect to [A] and [B], and hence the rate expression.
AnswerFirstly, remember that the stoichiometry of the equation has NO EFFECT on the rate equation. In experiments 1 & 2, the concentration of B is constant. Any effect on the initial rate is due to changing the concentration of A. The concentration of A doubles and at the same time the initial rate doubles. The concentration of A is directly proportional to the rate. The order with respect to [A] = 1. Between experiments 1 & 3 the concentration of A increases by a factor of four. This should engender a similar four-fold increase in the rate. However, in fact, the rate changes from 0.45 x 10⁻⁵ to 7.20 x 10⁻⁵, representing a 16-fold increase. This can only be due to the change in the concentration of B, which has doubled. Hence, doubling [B] causes an four-fold increase in the rate. The order with respect to [B] = 1. The rate equation is therefore: Rate = k [A]1[B]2 |
Q631-09 The following data were obtained for the reaction of compounds P and Q at constant temperature. The reaction can be represented by the rate expression:
Rate = [P]2[Q]
| initial [P]/mol dm-3 | initial [Q]/mol dm-3 | initial rate/ mol dm-3 s-1 | |
| Expt 1 | 0.20 | 0.30 | 4.80 x 10⁻³ |
| Expt 2 | 0.10 | 0.10 | |
| Expt 3 | 0.40 | 9.60 x 10⁻³ | |
| Expt 4 | 0.60 | 19.2 x 10⁻³ |
Find the concentration of Q in experiment 3.
AnswerThe order with respect to [P] is 1. Hence, the doubling of [P] between experiments 1 and 3 should cause a four-fold increase in the rate. But the rate changes from 4.80 x 10⁻³ to 9.60 x 10⁻³, which represents only a two-fold increase. The effect of [Q] on the rate is one of direct proportionality. Hence [Q] must have halved from Expt 1 to 3 to reduce the rate by a factor of 1. Hence, the value of [Q] in experiment 3 = 0.15 mol dm-3 |
Q631-10 The bromination of acetone that occurs in acid solution is represented by this equation.
CH3COCH3(aq) + Br2(aq) → CH3COCH2Br(aq) + H+(aq) + Br-(aq)
These kinetic data were obtained for given reaction concentrations.
|
Initial Concentrations,
/ mol dm-3 |
Initial Rate of disappearance of Br2,
/ mol dm-3 s-1 |
||
| [CH3COCH3] |
[Br2]
|
[H+]
|
|
|
0.30
|
0.050
|
0.050
|
5.7 x 10⁻⁵
|
|
0.30
|
0.10
|
0.050
|
5.7 x 10⁻⁵
|
|
0.30
|
0.10
|
0.10
|
1.1 x 10⁻⁴
|
|
0.40
|
0.050
|
0.20
|
3.1 x 10⁻⁴
|
Based on these data, what is the rate equation?
Answer|
In experiments 1 & 2 [CH3COCH3] and [H+]
are constant: In experiments 2 & 3 [CH3COCH3] and [Br2]
are constant: In experiments 3 & 4 nothing is constant but we already know that
the order is 0 wrt [Br2]: The concentration of [CH3COCH3] increases by a factor of 4/3. Multiplying this factor by the value expected of the rate, 2.4 x 10⁻⁴, gives 3.2 which is the rate in experiment 4. The order wrt [CH3COCH3] is 1. Therefore the rate expression is: Rate = k [CH3COCH3]1[Br2]0[H+]1 |
| Now test yourself |