Standard level
The shape of the 'pH against volume added' graph differs depending on the type of acid and base.
Syllabus ref: R3.1.8Reactivity 3.1.8 - pH curves for neutralization reactions involving strong acids and bases have characteristic shapes and features.
- Sketch and interpret the general shape of the pH curve.
Guidance
- Interpretation should include the intercept with the pH axis and equivalence point.
- Only monoprotic neutralization reactions will be assessed.
Tools and links
- Structure 1.4 - Why is the equivalence point sometimes referred to as the stoichiometric point?
- Tool 1 and Tool 3, Structure 1.3 - How can titration be used to calculate the concentration of an acid or base in solution?
Strong acid - strong base titrations
Titration curves are the graphs obtained by plotting the pH of the reaction mixture against the volume of base (or acid) added during the titration of either an acid by a base or vice versa.
A typical strong acid - strong base titration curve looks like as follows:
Weak acid - strong base titration
Weak base - strong acid titration
Weak acid with a weak base
This mixture cannot be titrated as the change in pH near the equivalence point is too small to allow reliable results.
Worked examples
Q882-01 Separate 20.0 cm3 solutions of a weak acid and a strong acid of the same concentration are titrated with NaOH solution. Which will be the same for these two titrations?- I. Initial pH
- II. pH at equivalence point
- III. Volume of NaOH required to reach the equivalence point
- I only
- III only
- I and II only
- II and III only
|
Volume of NaOH required to reach the equivalence point only |
Q882-02 What volume of 0.284 M NaOH is needed to titrate 100.00 cm3 of 0.124 M HCl to the equivalence point?
- 35.2 cm3
- 40.8 cm3
- 43.7 cm3
- 229 cm3
By the equation:
1 mole of acid is equivalent to 1 mole of base Moles of acid = 0.1 x 0.124 = 0.0124 this must equal moles of base, therefore molarity x volume base = 0.0124 = 0.284 x Vb Volume base = 43.66 cm3 |
Q882-03 What is the pH at the equivalence point in a titration of 0.020 M NH3(aq) with 0.020 M HBr(aq)? For ammonia, Kb = 1.8 x 10⁻⁵.
- 5.5
- 5.6
- 7.0
- 8.5
|
At the equivalence point there is only ammonium bromide present at a concentration of 0.01M
Kb = 1.8 x 10⁻⁵ therefore Ka of the conjugate acid = 5.56 x 10⁻¹⁰
assume that the [NH4+] is unaffected by the equilibrium Ka = [NH3][H3O+]/[NH4+] 5.56 x 10-10 x 0.01 = [NH3][H3O+] = [H3O+]2 Therefore [H3O+] = 2.36 x 10⁻⁶ Therefore pH = 5.6 |
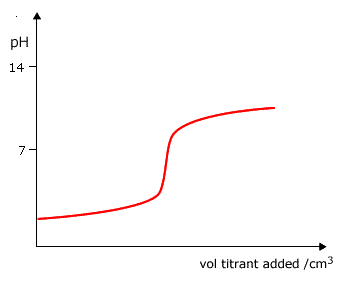
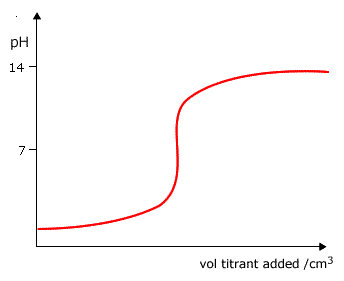
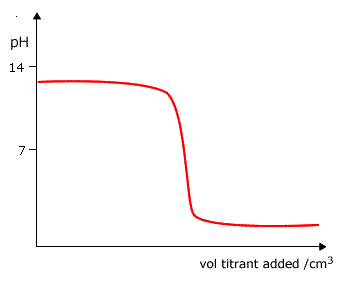
Q882-04 Which curve is produced by the titration of a 0.1 mol dm-3 weak base with 0.1 mol dm-3 strong acid?
 |
 |
 |
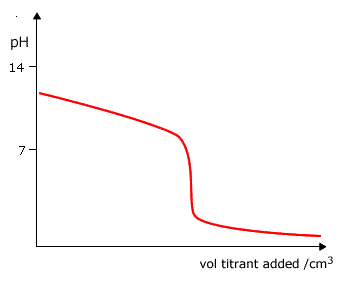 |
|
Curve D as it starts at a pH lower than 13 and ends up at a very low pH. |
Q882-05 Which graph shows how the pH changes when a weak base is added to a strong acid?
 |
 |
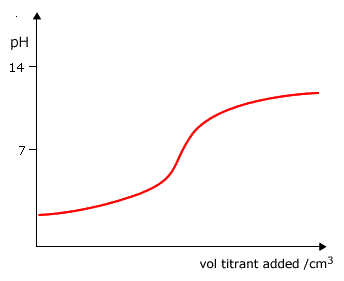 |
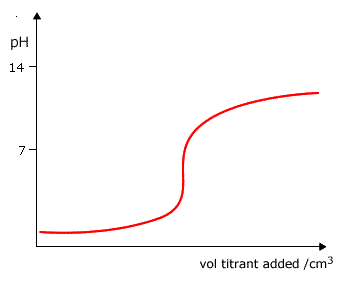 |
Answer
|
Weak base to strong acid - the pH starts very low pH=1 and rises to pH9-10, with a pronounced inflexion. Curve D |
 NH4+ + OH-