Higher-level only
The mass spectrometer is an important analytical instrument in both inorganic and organic chemistry. Nowadays, it may be combined with an initial gas chromatography stage giving an instrument that both separates and analyses at the same time (GCMS).
Syllabus ref: S1.2.3Structure 1.2.3 - Mass spectra are used to determine the relative atomic masses of elements from their isotopic composition. (HL)
- Interpret mass spectra in terms of identity and relative abundance of isotopes.
Guidance
- The operational details of the mass spectrometer will not be assessed.
Tools and links
- Structure 3.2 - How does the fragmentation pattern of a compound in the mass spectrometer help in the determination of its structure?
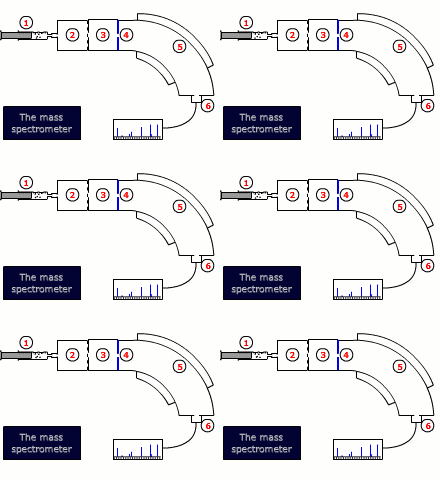
Instrumental details
There are two common designs for mass spectrometers:
- Magnetic deflection
- Time of flight
Both designs require that the sample is vaporised and then ionized by bombardment with high-energy electrons, that dislodge an electron from the sample molecule forming an ion. This ion is then accelerated by an electrical field.
The ions are then either deflected into the detector by a scanning magnetic field, or their trajectory is timed to arrive at a detector, depending on the type of instrument.
The final read-out may be graphical or digital and gives information about the relative abundance of all of the ions produced by the stream of electrons, as well as their exact mass to charge ratio, m/z. As the charge, z, is invariably 1+, this is equivalent to the mass.
Fragmentation
The energy of the electrons in the ionization chamber of the mass spectrometer not only can ionise the molecules it encounters, but also cause the ions produced to fragment into smaller pieces. This is called fragmentation. The smaller pieces, or fragments, themselves may be detected if they are in the form of ions. The peak that occurs at the highest m/e value is called the molecular ion. It is the ion produced by removing one electron from the molecule itself and can be used to determine the relative molecular mass of the species under investigation.
A typical molecular fragmentation pattern may look as follows:
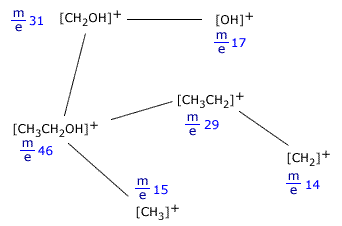
Fragmentation of ethanol, CH3CH2OH
Notice that only ions are shown as only ions can be detected in the mass spectrometer. When an ion fragments, it makes neutral species as well, but these cannot be detected, as they can neither be accelerated nor deflected by the magnetic field.
Example:[CH3CH2OH]+ → [CH3CH2]+ + [OH]
In this fragmentation, [OH] is produced but does not cause a trace on the spectrum.
The mass spectrum of chlorine Cl2
The chlorine spectrum shows several lines, all of which are due to positive ions formed in the mass spectrometer ioniser stage.
The line with the highest m/e value comes from the molecular ion, it is due to the [Cl2]+ ion. Chlorine has two different isotopes, therefore there are three possible molecular ions.
- [37Cl-37Cl]+
- [35Cl-37Cl]+
- [35Cl-35Cl]+
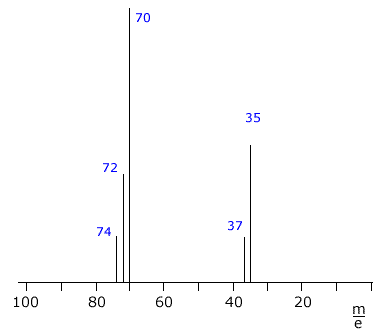
The remaining two lines at m/e 35 and m/e 37 are due to the ions [35Cl]+ and [37Cl]+ formed by fragmentation of the molecules.
The heights of the lines can be used to calculate the isotopic abundances.
In this case, the relative heights of the m/e 35 and m/e 37 lines is 3:1, showing the natural abundance of 35Cl and 37Cl to be 75% to 25% respectively.
Relative mass
The term relative atomic mass refers to the average mass of an atom of a specific element as compared to the 12 carbon isotope (equal to 12.0000 atomic mass units)
To calculate relative atomic masses from isotopic data you need:
- The relative mass of each isotope
- The percentage abundance of each isotope
With this data, relative mass calculation is a simple affair:
|
RAM =
|
(mass of isotope1 x % abundance isotope1) + (mass of isotope2 x % abundance isotope2) |
|
100
|
|
Example: Boron has two isotopes Boron-10 and Boron-11 which have relative abundancies of 20% and 80% respectively. In 100 atoms there are 20 Boron atoms with a mass of 10 and 80 Boron atoms with a mass of 11 Total mass of the boron atoms is:- (20 x 10) + (80 x 11) = 1080 Therefore the average mass of 1 atom is = 10.80 Boron has a relative atomic mass of 10.80 |
Mr determination from MS
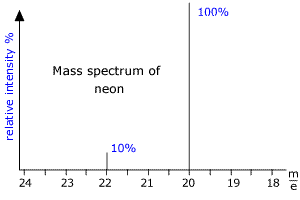 |
Here we can see that there are two peaks in the mass spectrum, one at m/e (this means mass to charge ratio) = 20 and the other at m/e = 22. These peaks correspond to the ions produced from the diferent isotopes of Neon. As neon has two common isotopes 20Ne and 22Ne, any naturally occurring sample of neon will contain these two isotopes. The mass spectrum shows that the peaks are in the ratio 10:1 and so there is 10 times as much 20Ne as 22Ne in the sample. From this data the relative atomic mass of neon can be calculated. RAM = [(10 x 20) + (1 x 22)]/11 = 20.2 |
Example: Rubidium has two isotopes Rubidium-85 and Rubidium 87 which have relative abundancies of 72% and 28% respectively.
In 100 atoms there are 72 Rb atoms with a mass of 85 and 28 Rb atoms with a mass of 87
Total mass of the rubidium atoms is:- (72 x 85) + (28 x 87) = 8556
Therefore the average mass = 85.56
Rubidium has a relative atomic mass of 85.56
Relative molecular mass
The mass spectrometer is an instrument used for three main purposes:
- 1 Measuring the exact relative masses of elements (section 1.22).
- 2 Measuring exact releative molecular formula mass
- 3 Measuring the masses of the breakdown products from molecules when they are smashed to pieces by high energy electrons. This is also called the fragmentation pattern and may be useful in elucidation of the structure of a molecule.
Accurate mass measurement
The ions can be focussed onto the detector electronically. This allows determination of the m/e of the ion, to an accuracy of 8 decimal places. The mass of the electron that has been lost can be taken into account, giving masses for the atoms that are very accurate.
Molecular formulae determination
The masses of the atoms can be found to such great accuracy that the mass of each molecule becomes unique, according to the number and type of each atom present.
Example: The relative molecular mass of carbon monoxide = C + O = 28 (to two significant figures places)
The relative molecular mass of nitrogen = N + N = 28 (to two significant figures places)
But, using high resolution mass spectrometry
- Mass of 16oxygen = 15.99491
- Mass of 14nitrogen = 14.00307
- Mass of 12carbon = 12.00000
It should be appreciated that the following peaks are easily differentiated:
- a peak due to 12C16O (carbon monoxide) is found at 27.99491
- a peak due to 14N14N is found at 28.00614
Structural information
Spectra of molecules are rather more complex due to the breakup (fragmentation) of the molecule in the electron beam.
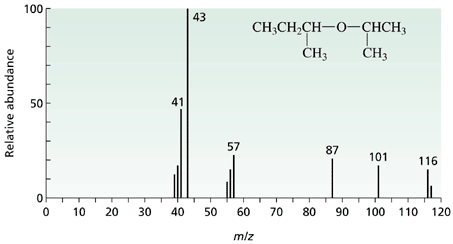
Here we can see that there is a fragmentation pattern caused by the molecule breaking apart in the electron bombardment.
The molecule is shown on the spectrum and the most important peak is the one at m/e = 116 which gives the relative molecular mass of the molecule. This peak is said to be due to the "molecular ion" and is caused by the molecule itself losing only one electron before going to the detector.
The m/e value of the molecular ion can be measured to such a degree of accuracy (many decimal places) that it can be used to determine the exact number of each type of atom within the molecule.
A full treatment of the fragmentation pattern is possible to give information regarding how the molecule is bonded together, but not required for this section.
Worked examples
Q123-01 Relative atomic and molar masses are determined with a mass spectrometer utilizing the fact that- the velocity of the particles can be accurately determined.
- a definite fraction of the particles is formed in a charged state.
- all particles with the same charge to mass ratio follow the same curved path.
- the force with which the accelerated particles strike a target can be measured.
|
The focus of ionised particles at the detector depends on the charge to mass ratio, m/e. All particles with the same m/e value can be focussed with great accuracy on the detector. Correct response = C |
Q123-02 What is the correct sequence for the processes occurring in a mass spectrometer?
- vaporization, ionization, acceleration, deflection
- vaporization, acceleration, ionization, deflection
- ionization, vaporization, acceleration, deflection
- ionization, vaporization, deflection, acceleration
|
The correct sequence of operations is vaporization, ionization, acceleration, deflection |
Q123-03 Which ion would undergo the greatest deflection in a mass spectrometer?
- 16O+
- 16O2+
- 18O2+
- (16O18O)+
|
The particles with the smallest value of mass/charge ratio are deflected most easily. In this case the ion 16O2+ has the smallest mass and the largest charge - response B |
Q123-04 Why do peaks in mass spectra have different heights?
Answer
|
The height of a peak in a mass spectrometer gives a measure of the probablility of that ion being created. In simple spectra of elements the heights of the peaks are proportional to the relative abundances of the isotopes of the element. |
Q123-05 Why do small lines appear on the mass spectrum of neon at m/e 10 and 11, when the isotopes have masses of 20 and 22 atomic mass units?
Answer
|
The mass spectrometer measures the mass/charge ratio. Normally single plus ions are formed in the ionization stage, but it is possible for a neon atom to lose two electrons by collisions with the electron beam. These 2+ ions will have a mass/charge ratio of exactly half that of the single plus charged ions. The line at m/e 10 is due to 20Ne2+ and the line at 11 is due to 22Ne2+ |
Q123-06 Which of the following particles could be detected in a mass spectrometer?
- H2O+
- CO2
- Cl-
- CH3
|
Only positive ions can be detected in the mass spectrometer, therefore H2O+ can be detected. |
Q123-07 The species responsible for the line that appears in the spectrum at the highest m/e value is called which of the following:
- The heaviest ion
- The molecular ion
- the atomic ion
- the double ion
|
The species responsible for the highest trace on the mass spectrum is called the molecular ion. |
Q123-08 While carrying out a reaction, a chemist notices the evolution of a gas. A sample of this gas gave a mass spectrum in which the molecular ion (m/e = 44) was the largest ion peak. The only other significant peaks were observed at m/e = 28 and m/e = 16. Deduce the identity of the gas?
Answer
|
The peak at the highest m/e value is the molecular ion, hence the realtie mass of the molecule is 44. Other peaks occurred at m/e 28 and m/e 16. The relative mass of an oxygen atom is 16 and also 44 - 16 gives 28 so it looks like the peak at 28 is due to loss of an oxygen atom. Mass 28 suggests an oxygen and a carbon atom combined so we can conclude that the peaks are due to:
Therefore the unknown gas is carbon dioxide |
Q123-09 Chlorine consist of two common isotopes 35Cl and 37Cl with abundances of approximately 75% and 25%. How many lines will be seen on the mass spectrum of chlorine?
|
There are three lines due to the chlorine molecular ions [Cl2]+ at m/e 74, m/e 72 and m/e 70. There are also two lines due to the atomic ions [35Cl]+ and [37Cl]+ Thus there are five lines |
Q123-10 Sulfur vapour is injected into a mass spectrometer for analysis. If the vapour consists of S2 molecules and there are three isotopes of sulfur 32S, 34S and 36S, determine the number and m/e values of the lines that appear on the mass spectrum.
|
The possible combination of atoms in the S2 molecules is as follows:
Notice that two different molecular ions fall at the same m/e values. Using a very high resolution mass spectrometer, it is possible to differentiate between them. There are, of course, also three lines due to the three different isotopes of sulfur at m/e 32, 34 and 36. |
 Answer
|
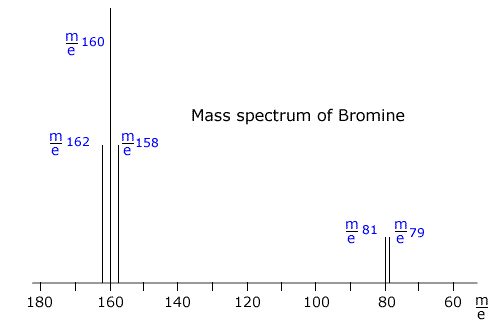
Bromine consists of Br2 molecules. These molecules can be made up of one of the following combinations:
So there will be three lines at 79 + 79 = m/e 158, 79 + 81 = m/e 160, and 81 + 81 = m/e 162, due to the ions formed from the molecules. There will also be lines due to the ions 81Br+ and 79Br+. There are five lines in the spectrum at m/e 162, 160, 158, 81 and 79 |
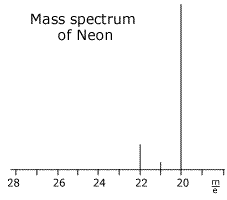
Q123-12 According to the mass spectrum in the diagram below, the relative atomic mass of the element shown is best expressed as which of the given possibilities:
- 20.0
- between 20.0 and 21.0
- 21.0
- between 21.0 and 22.0
 Answer
|
The 20 - isotope is by far the most abundant and will contribute more to the weighted average of the relative mass. The correct response = B, between 20.0 and 21.0 |
Q123-13 In the mass spectrum of chlorine the line at m/e 35 is about three times more intense (higher) than the line at m/e 37. What information can be obtained from this observation?
Answer
|
The height of the line in the mass spectrum is directly proportional to the abundance of the sample species injected. In this case the information tells us that the isotope 35Cl is about three times as abundant as 37Cl This then allows calculation of the relative atomic mass of chlorine. In every four parts of the sample there are three atoms with a mass of 35 and one with a mass of 37 The relative atomic mass = [(3 x 35) + 1 x 37)]/4 = 35.5 |
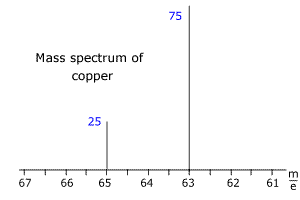
Q123-14 The following diagram shows the mass spectrum of copper with the relative intensities of the ions detected. Use this information to calculate the relative atomic mass of copper.
 Answer
|
The lines at m/e 63 and 65 have relative intensities of 75% and 25% respectively. Thus in any sample of 100 atoms there are 75 with a mass of 63, and 35 with a mass of 65 mass units. The relative atomic mass of copper = [(75 x 63) + (25 x 65)]/100 Therefore the relative mass of copper = 63.5 |
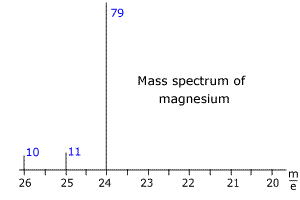
Q123-15 The mass spectrum of magnesium is shown below. The blue numbers refer to the relative intensity of the peaks. Use the spectrum to calculate the relative mass of magnesium.
 Answer
|
The intensities of the lines add up to 100 and therefore can be taken as the percentage abundances. Relative mass = [(79 x 24) + (11 x 25) + (10 x 26)]/100 Relative mass of magnesium = 24.31 |
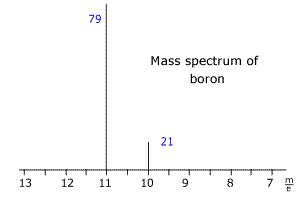
Q123-16 The mass spectrum of boron is shown below. The blue numbers refer to the relative intensity of the peaks. Use the spectrum to calculate the relative mass of boron.
 Answer
|
The two isotopes of boron have m/e values of 10 and 11 respectively. The intensities add up to 100 (very convenient!) so the intensities represent the percentage abundances. Relative mass = [(79 x 11) + (21 x 10) ]/100 = 10.79 |
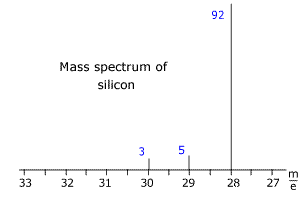
Q123-17 The mass spectrum of silicon is shown below. The blue numbers refer to the relative intensity of the peaks. Use the spectrum to calculate the relative mass of silicon.
 Answer
|
The three isotopes of silicon have m/e values of 28, 29 and 30. The intensities add up to 100 (very convenient!) so the intensities represent the percentage abundances. Relative mass = [(28 x 92) + (29 x 5) + (30 x 3)]/100 = 28.11 |
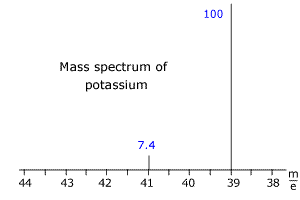
Q123-18 The mass spectrum of potassium is shown below. The blue numbers refer to the relative intensity of the peaks. Use the spectrum to calculate the relative mass of potassium to two decimal places.
 Answer
|
The two isotopes of potassium have m/e values of 41 and 39. The intensities DO NOT add up to 100, so the sum of the intensities must be used to calculate the relative atomic mass. Sum of intensities = 107.4 Relative mass = [(100 x 39) + (7.4 x 41)]/107.4 = 39.14 |
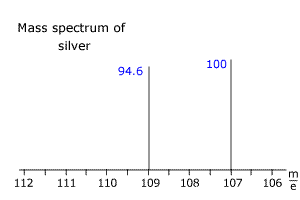
Q123-19 The mass spectrum of silver appears below. Use the information to calculate the relative atomic mass of silver.
|
The two isotopes of silver have m/e values of 107 and 109. The intensities DO NOT add up to 100, so the sum of the intensities must be used to calculate the relative atomic mass. Sum of intensities = 194.6 Relative mass = [(100 x 107) + (94.6 x 10⁹)]/194.6 = 107.97 |
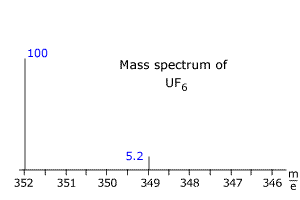
Q123-20 A sample of uranium hexafluoride gas was extracted from the centrifuges in a nuclear processing plant and analysed by MS to find the percentage of 235U enrichment. The following spectrum was obtained (only the relevant portion is shown). Fluorine has only one isotope with a relative mass of 19. Use this information to calculate the percentage uranium-235 in the sample.
|
235Uranium hexafluoride, 235UF6, has relative mass = (19 x 6) + 235 = 349 238Uranium hexafluoride, 238UF6, has relative mass = (19 x 6) + 238 = 352 From the relative intensities, using the total intensity sum = 105.2 The percentage 235UF6 (and hence the % enrichment of uranium) in the sample = 5.2/105.2 x 100 = 4.94% |
External video resources
Interpretation of Mass Spectra of isotopes: Richard Thornley