|
Hydrogen has one of the simplest emission spectra as there is only one electron per atom that can absorb and re-emit energy. Syllabus referenceStructure 1.3.2 - The line emission spectrum of hydrogen provides evidence for the existence of electrons in discrete energy levels, which converge at higher energies.
Guidance
Tools and links
|

The electron in the ground state energy level of the hydrogen atom receives energy in the form of heat or electricity and is promoted to a higher energy level.
It cannot remain at a higher level (excited state) for very long, and falls back to a lower level.
When the electron falls back down (relax) it must lose the energy difference between the two energy levels. This loss of energy is performed by releasing electromagnetic energy in the form of infrared, visible light or ultraviolet radiation.
Movement of electrons between the shells is called electron transitions.
When electron transitions take place the energy emitted can be detected and its wavelength measured. This provides information about the relative energies of the shells.
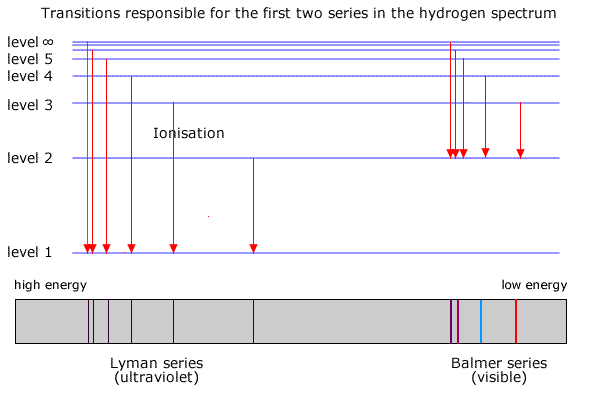
In the hydrogen atom (the simplest case with only one electron to 'jump' between shells) the energy emitted appears in several series of lines, each series corresponding to electrons falling back to different levels. This is shown in the diagram below.
The Lyman series corresponds to transitions between the higher shells and the lowest shell (ground state). The energy of these transitions produces radiation in the ultra-violet region of the spectrum

The energy shells are usually given a letter 'n' to describe the specific energy level. The lowest level is n=1, the second level is n=2 etc.
Transitions from higher shells (n>2) to n=2 produce radiation in the visible region of the spectrum. It can be seen by splitting the light using a prism or diffraction grating and projecting it onto a screen.
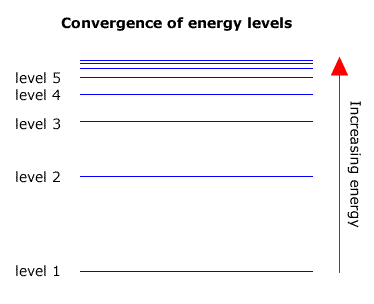
As the energy levels increase in energy they get closer together. In other words level 2 and level 3 are further apart than level 3 and level 4. The levels converge towards a limit.

Transitions that occur in any series must also converge towards a high energy limit, as the largest transition is between the highest energy level and the level that is characteristic of the specific series.
The highest level is sometimes refered to as the 'infinite' level, as the levels get so close together where they converge that they are impossible to count.
Ionisation and the convergence limit
Structure 1.3.6 - In an emission spectrum, the limit of convergence at higher frequency corresponds to ionization. (HL)
- Explain the trends and discontinuities in first ionization energy (IE) across a period and down a group. Calculate the value of the first IE from spectral data that gives the wavelength or frequency of the convergence limit.
Guidance
- The value of the Planck constant h and the equations E = h f and c = λ f are given in the data booklet.
Tools and links
- Structure 3.1 - How does the trend in IE values across a period and down a group explain the trends in properties of metals and non-metals?
- Nature of science, Tool 3, Reactivity 3.1 - Why are log scales useful when discussing [H+] and IEs?
When dealing with the Lyman series in the ultraviolet, the transitions are down to the ground state (level 1). The largest transition must represent a fall from the infinite level, ∞, to level 1. Viewed in reverse it can be considered to be equal to the ionisation energy, as this is the energy required to move an electron from the ground state to the infinite level (Note: Ionisation energy is usually expressed per mole of electrons).
| M(g) → M+(g) + 1e |
Consequently, the ionisation energy may be found by examining the Lyman series at the convergence limit. The wavelength of light corresponding to the convergence limit may be converted to energy using the relationship E = hc/l
|
Example: Calculate the ionisation energy of hydrogen, if the lines of the Lymann series converge to a limit at a wavelength of 90.1 nm. h, (Planck's constant) = 6.63 x 10⁻³⁴, c, speed of light = 2.99 x 10⁸ ms-1 E = hc/l wavelength 90.1 nm = 9.01 x 10⁻⁸ m Therefore Energy = (6.63 x 10-34 x 2.99 x 108)/9.01 x 10-8 ∴ E = 2.17 x 10⁻¹⁸ ∴ Energy/mole = 2.17 x 10-18 x 6.02 x 1023 ∴ Energy/mole = 1.308 x 10⁶ Joules ∴ Energy = 1308 kJ mol-1 Ionisation energy of hydrogen = 1308 kJ mol-1 |
This method may be used to find the first ionisation energy of any element.
The wavelength (or wavenumber) values corresponding to the convergence limits are available in data books or in the excellent NIST physics resource.
