Electrochemistry - Potential difference of voltaic cells
Background
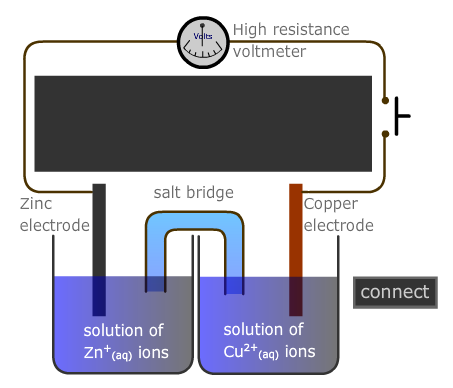
A voltaic cell can be assembled from two half-cells and the potential difference measured using a high-resistence voltmeter, as in the diagram below.
Different investigations can be designed using varying concentrations of the solutions, or temperature.
Chemicals
- Copper(II) sulfate pentahydrate, CuSO4.5H2O
- Zinc sulfate heptahydrate, ZnSO4.7H2O
- Potassium nitrate, KNO3
- Copper foil
- Zinc foil
- Distilled (deionized) water
Apparatus
- Beakers, 100ml
- Spatula
- Glass stirring rod
- Weighing boat
- Top pan balance
- Filter paper
- Cables and crocodile clips
- High-resistance voltmeter
- Pipette, 10ml, and pipette filler
- 2 x Volumetric flask, 100ml
- Digital or analogue thermometer
Procedure - The effect of [Cu2+] on the EMF of a copper|zinc voltaic cell.
Preparing the solutions
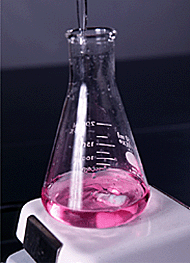
- Prepare 100 cm3 of 1 mol dm-3 copper(II) sulfate solution, by weighing an appropriate mass of copper(II) sulfate pentahydrate and stirring into 80 cm3 of distilled water in a 100 cm3 beaker.
- Transfer the solution to a 100 cm3 volumetric flask and make up to the mark with distilled (deionized) water.
- Repeat the procedure using zinc sulfate heptahydrate.
- Prepare a saturated solution of potassium nitrate using a 50 cm3 beaker.
Measuring the potential difference
- Using about 50cm3 of each solution, construct the voltaic cell as in the diagram above, and connect the two half-cells by a salt bridge made by soaking a strip of filter paper in the saturated potassium nitrate solution.
- Record the temperature of the two half-cells.
- Prepare 100 cm3 of a 0.1 mol dm-3 solution of the copper(II) sulfate by dilution of the original solution.
- Measure the potential difference between the diluted copper(II) sulfate solution and the original zinc sulfate solution.
- Repeat the dilution process to obtain solutions of 0.01, 0.001 and 0.0001 mol dm-3 concentration of copper ions and measure the new potential difference.
- Record all data in a suitable table.
Processing the data
- Plot a graph of potential difference (y-axis) against log10[Cu2+] (x-axis).