Higher-level only
Atoms are too small to be seen. We can only obtain information indirectly by stimulating the atoms with energy of various forms and detecting what emerges.
Syllabus ref: S1.3.6Structure 1.3.6 - In an emission spectrum, the limit of convergence at higher frequency corresponds to ionization. (HL)
- Explain the trends and discontinuities in first ionization energy (IE) across a period and down a group. Calculate the value of the first IE from spectral data that gives the wavelength or frequency of the convergence limit.
Guidance
- The value of the Planck constant h and the equations E = h f and c = λ f are given in the data booklet.
Tools and links
- Structure 3.1 - How does the trend in IE values across a period and down a group explain the trends in properties of metals and non-metals?
- Nature of science, Tool 3, Reactivity 3.1 - Why are log scales useful when discussing [H+] and IEs?

1st ionization energies of successive elements
The first ionization energy of an element is defined as the energy required to remove 1 mole of electrons from one mole of gaseous atoms under standard conditions.
M(g) → M+(g) + 1e
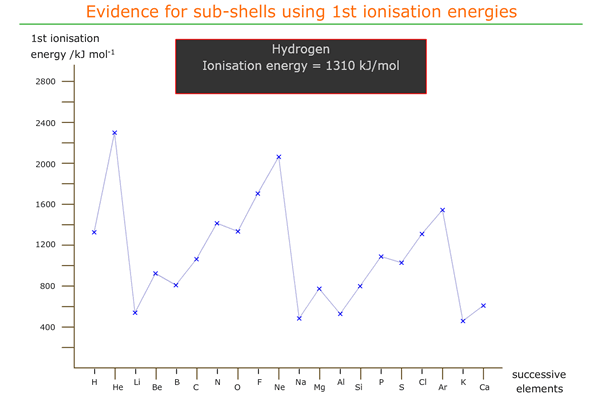
A graph of first ionization energy against atomic number shows how the first ionization energy varies moving from element to element in the periodic table. The outermost electron is being removed in each case and so the amount of energy needed to remove it is a function of the force holding the electron in position around the atom.
This force is dependent on two main factors and is 'fine-tuned' by a third factor.
- 1 The charge on the nucleus
- 2 The distance of the outer electron from the nucleus
- 3 Inter-electron repulsions
As the charge on the nucleus increases so the energy required to remove the electron increases. As the distance between the outermost electron and the nucleus increases so the energy required to remove it decreases.
Anomalies in 1st ionization energy across a period
On inspection of the graph we see that there are inflexions moving across a period that seem to be contrary to the effect of increasing nuclear charge.
Moving from beryllium to boron there is a decrease in 1st ionization energy. This can be explained as being due to the location of boron's outer electron in a 'p' orbital, which is of slightly higher energy (further from the nucleus on average).
Hence, less energy is required to remove the 2px electron from boron than the 2s electron from beryllium.
There is another inflexion from nitrogen to oxygen that must also be explained.
It appears that the energetic effect of pairing up two electrons in a 'p' orbital increases the energy of that orbital (or at least, the electrons in that orbital), meaning that less energy than expected is required to ionise one of them.
Both of these apparently anomalous inflexions also repeat across the third period, from magnesium to aluminium and from phosphorus to sulfur, with the same explanations.

1st ionization energies across the first 20 elements
Convergence
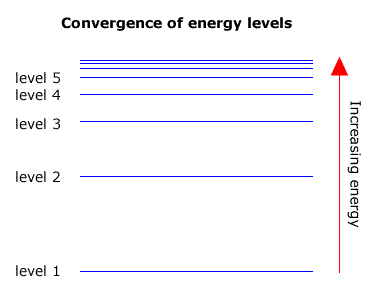
As the energy levels increase in energy they get closer together. In other words level 2 and level 3 are further apart than level 3 and level 4. The levels converge towards a limit.

Transitions that occur in any series must also converge towards a high energy limit, as the largest transition is between the highest energy level and the level that is characteristic of the specific series.
The highest level is sometimes refered to as the 'infinite' level, as the levels get so close together where they converge that they are impossible to count.
Ionization from the convergence limit
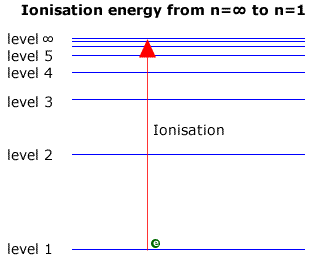
When dealing with the Lyman series in the ultraviolet, the transitions are down to the ground state (level 1). The largest transition must represent a fall from the infinite level, ∞, to level 1. Viewed in reverse it can be considered to be equal to the ionization energy, as this is the energy required to move an electron from the ground state to the infinite level (Note: ionization energy is usually expressed per mole of electrons).
M(g) → M+(g) + 1e
Consequently, the ionization energy may be found by examining the Lyman series at the convergence limit. The wavelength of light corresponding to the convergence limit may be converted to energy using the relationship E = hc/l

Example:Calculate the ionization energy of hydrogen, if the lines of the Lymann series converge to a limit at a wavelength of 90.1 nm.
h, (Planck's constant) = 6.63 x 10⁻³⁴, c, speed of light = 2.99 x 10⁸ ms-1
E = hc/l
wavelength 90.1 nm = 9.01 x 10⁻⁸ m
Therefore Energy = (6.63 x 10-34 x 2.99 x 108)/9.01 x 10-8
∴ E = 2.17 x 10⁻¹⁸
∴ Energy/mole = 2.17 x 10-18 x 6.02 x 1023
∴ Energy/mole = 1.308 x 10⁶ Joules
∴ Energy = 1308 kJ mol-1
ionization energy of hydrogen = 1308 kJ mol-1
This method may be used to find the first ionization energy of any element.
The wavelength (or wavenumber) values corresponding to the convergence limits are available in data books or in the excellent NIST physics resource.
Summary
Spectral lines give evidence of electrons moving from one energy level to another within the atom.
Successive ionisations of an atom suggest that there are energy shells with large energy differences between them.
The 1st ionization energies of the first 36 elements suggests that the energy shells are split up into sub-shells and that some of these sub-shells have further divisions (orbitals).
