|
It is important to define the term 'reaction rate' before proceding to measure and process data. |
|
Definition of rate
As a chemical reaction proceeds the reactants get used up and the products are formed. At any specific time in the course of the reaction the amount (mass, moles, concentration etc) of the reactants compared to the amount at the beginning of the reaction gives us a measure of how far the reaction has gone.
In the same way as a car's velocity is measured in distance travelled/ time taken so the rate of a chemical reaction is measured as change in reactant (or product) amount / time taken
We are usually concerned with the concentration of the reactants and if we can measure how this changes with time then this provides us with the best definition of reaction rate.

Stoichiometry
The stoichiometry (balanced coefficients) of a reaction gives no indication as to the rate of that reaction. It does, however, tell us the relative rate of consumption of reactants and formation of products.
If we examine the reaction between sulfur dioxide and oxygen to form sulfur trioxide in the contact process:
2SO2(g) + O2(g) → 2SO3(g)
On purely stoichiometric grounds, we can see that for every 2 moles of sulfur dioxide that gets used up only 1 mole of oxygen will be consumed. Thus, if the rate of removal of sulfur dioxide is 2 moles per minute, then the rate of removal of oxygen must be 1 mole per minute.
We can, of course, extend this to include the products. If the rate of removal of sulfur dioxide is 2 moles per minute, then the rate of formation of sulfur trioxide is also 2 moles per minute.
|
Example: Calculate the rate of formation of ammonia in the Haber process, if the rate of consumption of nitrogen is 2 mol s-1. N2(g) + 3H2(g) → 2NH3(g) From the equation we can see that the ratio of moles of nitrogen to ammonia is 1:2. Therefore as 1 mole of nitrogen is used up 2 moles of ammonia is formed. Hence the rate of formation of ammonia = 2 x the rate of consumption of nitrogen. Therefore the rate of formation of ammonia = 2 x 2 = 4 mol s-1 |
Reactant concentration
To obtain the rate of change of concentration, we need to know the volume in which the reaction is proceeding. This can be applied to gases as well as solutions. Remember, however, that solids can not be included in calculations of this kind. The concentration of a reactant is usually measured in moles per litre (mol dm-3).
|
Example: Calculate the concentration of sulfur IV oxide gas if 4 moles occupy 2 litres Concentration is measured in moles per litre - mol dm-3 Therefore the concentration = 4/2 = 2 mol dm-3 |
Rate of change of concentration
Combining the above two ideas allows us to calculate rates in terms of concentration change with time. If the concentration changes from 6.2 x 10⁻³ mol dm-3 to 2.8 x 10⁻³ mol dm-3 in 20 seconds then the average rate over this portion of the reaction is:
|
Average rate =
|
(6.2 x 10⁻³) - (2.8 x 10⁻³)
mol dm-3
|
|
20
|
Average rate = 3.4 x 10⁻³ mol dm-3 s-1
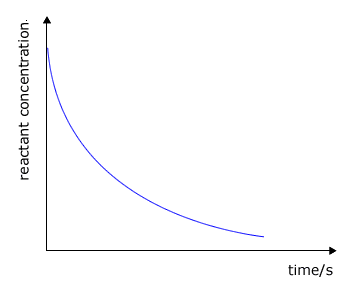
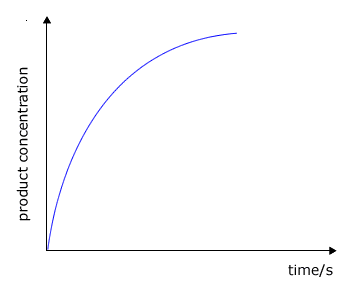
During the course of a reaction the concentration of reactants decrease as they are used up and at the same time the concentration of the products increases
 |
 |
|
|
reactant concentration against time
|
product concentration against time
|
Initial rate
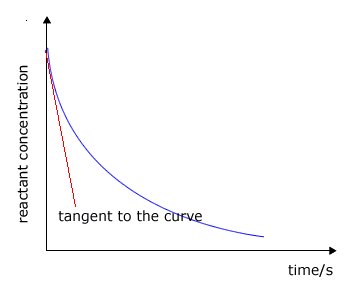
The rate of change of concentration may be obtained from the graphs above by measuring the gradient of the tangent to the curve. However, it should be apparent that the rate changes as the reaction proceeds. At the beginning of the reaction the gradient or slope of the curve is at a maximum and gradually decreases as the reaction continues.
 |
The tangent (red line) is the line that just touches the curve and lies at 90º to the radius of curvature. This is not very easy to judge and involves a fair amount of error. |
|
Graph showing the tangent to the curve
|
 |
Once a tangent to the curve has been drawn, the gradient may be found by measuring the difference in the y-value (concentration) divided by the difference in the x-value (time). It makes sense to choose values for the y-axis that give a simple number for the y difference. |
|
Measuring the gradient
|
gradient =
|
To measure the rate, we must make a decision about when to measure it. The only time that we can be certain about the actual concentration of the reactants is at the very beginning of the reaction, so it makes sense to measure the rate at the start. This is called the initial rate of the reaction.
Average rate
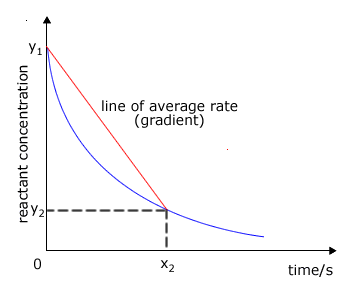
It may not be possible to measure the initial rate for certain reactions, in which case we can choose to measure the average rate over a specific range of the reaction. We do this by timing how long a reaction takes to reach a certain stage.
 |
In this example, the reaction is timed until the concentration of the reactants reaches the value y2. The red line then joins the initial concentration of reactant to the curve at y2. This red line represents the way the concentration would have changed if the rate were constant. The gradient of this line then gives the average rate for the reaction from time 0 to time x2. |
|
average rate graph
|
gradient =
|
The average rate is the rate measured over a certain range of a reaction.
|
Example: The rate of the reaction between sodium thiosuphate and dilute acid may be followed by observing the increased opacity of the solution as it slowly forms a precipitate of sulfur. S2O32-(aq) + 2H+(aq) → H2O(l) + SO2(g) + S(s) If the reaction is performed in a beaker with a mark on the side then the reaction can be timed until the mark is no longer visible through the liquid. The time taken to reach this point is inversely proportional to the average rate. Average rate |

